Beyond Page Views: The Metrics That Truly Define Content Success
In the competitive digital space, simply creating content is not enough. To capture attention, drive growth, and prove value, you must understand precisely how your output performs. However, relying on vanity metrics like raw page views can be misleading. True content mastery lies in digging deeper, analyzing the full spectrum of engagement, influence, and conversion to understand audience behavior and its direct impact on your business goals. These insights are fundamental not just for content creators but also for broader marketing efforts; for a wider view, exploring key marketing performance metrics to track can provide valuable context.
This guide moves beyond the surface to explore the 8 most crucial content performance metrics that empower data-driven decisions. We will break down not just what to measure, but why each metric matters, how to track it accurately, and how you can leverage these insights to create more effective content that resonates with your audience and delivers tangible results. Expect actionable strategies for each of the following:
- Page Views (Traffic Volume)
- Time on Page / Session Duration
- Social Media Engagement Rate
- Click-Through Rate (CTR)
- Conversion Rate
- Bounce Rate
- Content Shares and Viral Coefficient
- Return on Investment (ROI) and Revenue Attribution
By the end of this article, you'll have a clear framework for evaluating your content's true impact.
1. Page Views (Traffic Volume)
Page views represent the total number of times a specific page on your website has been loaded by a browser. This metric is a foundational pillar among content performance metrics, offering a direct, unfiltered look at your content's initial reach and visibility. Each time a user loads or reloads a page, it counts as one page view, making it a pure measure of traffic volume and a critical starting point for any content analysis.

While sometimes dismissed as a "vanity metric," page views are indispensable for understanding the top of your content funnel. A high number of page views indicates strong performance in discovery channels like SEO, social media, and email newsletters. For example, a media giant like The New York Times monitors page views in real-time to decide which articles gain premium placement on its homepage, capitalizing on emergent reader interest. Similarly, content platforms like Medium use this data to identify trending topics and reward its most popular writers, demonstrating its direct commercial and editorial value.
How to Leverage Page View Data
To transform raw traffic data into actionable strategy, you must analyze it with context. Start by segmenting your page views to uncover deeper insights.
- Track Traffic Sources: Use UTM parameters in your marketing campaigns to see which channels (e.g., organic search, social media, paid ads) are driving the most traffic. This helps you allocate your budget and effort more effectively. For a deeper dive, you can learn more about essential strategies that drive real growth to amplify these sources.
- Analyze Content Types: Compare page views across different formats, such as blog posts, case studies, and landing pages. This reveals which content types resonate most with your audience, guiding your future content calendar.
- Identify Trends Over Time: Monitor page view trends to pinpoint optimal days and times for publishing new content. A sudden spike might indicate a viral hit, while a steady decline could signal that a topic's relevance is fading.
2. Time on Page / Session Duration
Time on Page measures the average duration a user spends viewing a specific piece of content, while Session Duration calculates the total time from a user's first interaction to their last on your site within a single visit. As essential content performance metrics, these indicators move beyond initial traffic to gauge genuine user engagement and content value. A high Time on Page suggests your content is compelling and holds attention, while a lengthy Session Duration indicates your site effectively encourages further exploration.
These metrics are critical for assessing content quality. For example, Wikipedia meticulously analyzes time-on-page data to refine article structure, adding elements like tables of contents and infoboxes to improve readability and user experience. Similarly, streaming giant Netflix heavily relies on session duration to measure a show's binge-worthiness and inform its powerful recommendation engine. This demonstrates that tracking how long users engage is a direct reflection of how valuable they find your content, making it a cornerstone of effective content strategy.
How to Leverage Engagement Time Data
Analyzing engagement time helps you understand what truly captivates your audience. Contextualize this data to turn seconds and minutes into strategic improvements.
- Correlate with Content Depth: Compare Time on Page with your content's length (word count for articles, runtime for videos). A long article with a short average time on page may indicate that the introduction failed to hook the reader or the content was difficult to read. Tools like scroll-depth tracking can further clarify how far down the page users get before they leave.
- Analyze User Behavior Patterns: Use heat mapping tools alongside time-based metrics to see where users are spending their time on the page. Are they hovering over specific images, re-reading certain paragraphs, or engaging with interactive elements? This visual data adds qualitative insight to your quantitative time metrics.
- Segment by Traffic Source: Monitor engagement times for users arriving from different channels. You might find that visitors from organic search spend more time on your educational blog posts, while traffic from social media engages longer with short-form video content. This insight allows you to tailor content distribution strategies for maximum impact.
- A/B Test for Optimal Engagement: Experiment with different content formats. Test a listicle against a long-form narrative, or an article with an embedded video against one with static images. By comparing the Time on Page for each version, you can identify which formats are most effective at holding your audience's attention and apply those learnings to future content creation.
3. Social Media Engagement Rate
Social media engagement rate measures the level of interaction your content receives, such as likes, comments, shares, and saves, relative to your audience size or reach. This metric is a crucial component of content performance metrics because it moves beyond simple visibility to gauge how well your content resonates and connects with your audience. A high engagement rate indicates that your content is not just being seen, but is also compelling, valuable, and sparks conversation.

Unlike passive views, engagement signifies an active audience, which is a powerful indicator of brand loyalty and community health. For instance, the beauty brand Glossier built its empire on the back of strong community engagement, often achieving rates above 3% on Instagram by prioritizing user-generated content. Similarly, National Geographic leverages stunning visual storytelling to maintain exceptionally high engagement, proving that quality content directly translates into an active and invested following. This metric validates your content strategy and shows that your message is hitting the mark.
How to Leverage Engagement Rate Data
Transforming likes and shares into a robust content strategy requires a focused analysis of what drives interaction. Use engagement data to refine your social media approach and build a stronger community.
- Analyze Top-Performing Posts: Regularly review the posts with the highest engagement rates. Identify common themes, formats (e.g., video, carousels, infographics), and calls to action. Use these insights to replicate success and inform your future content calendar.
- Encourage Interaction: Actively invite engagement by asking questions, running polls, and using platform-native features like Instagram Stories or live videos. Responding promptly to comments not only boosts the metrics for that post but also fosters a sense of community. To learn more, explore these modern audience engagement strategies for real results.
- Segment by Platform: Engagement varies across different social networks. Beyond general engagement, specific platforms offer unique insights. Learn how to boost your Twitter engagement rate to gain a deeper understanding of your social media content's impact and tailor your strategy for maximum effectiveness on each channel.
4. Click-Through Rate (CTR)
Click-through rate (CTR) measures the percentage of users who click a specific link after viewing it. It’s calculated by dividing total clicks by total impressions (views) and is a cornerstone among content performance metrics for gauging how compelling your content is at the point of first contact. Whether it's an email subject line, a search engine result, or a social media post, CTR directly reflects your ability to convert visibility into engagement and move users to the next stage of their journey.
This metric is essential for evaluating the effectiveness of headlines, meta descriptions, and calls-to-action. For instance, Google Ads reports an average search ad CTR of 3.17%, but a high-performing ad can achieve much more. Similarly, the viral content pioneers at Upworthy famously A/B tested headlines to drive CTRs from a standard 2-3% to an exceptional 8-12%, demonstrating how optimizing for clicks can dramatically amplify content reach and impact. A high CTR signals that your messaging perfectly aligns with user intent and curiosity.
How to Leverage CTR Data
Improving your CTR requires a focus on crafting irresistible invitations to your content. Analyze this metric to refine your communication and maximize engagement.
- Write Compelling Headlines and Copy: Your headline is your first and often only chance to earn a click. Make it specific, benefit-driven, and aligned with user search intent. A/B test different headline variations to identify which formulas resonate most effectively with your target audience.
- Optimize Calls-to-Action (CTAs): Don't just ask users to "click here." Use action-oriented language that clearly communicates value, like "Download Your Free Guide" or "Get Instant Access." Experiment with CTA button colors, text, and placement to find the combination that drives the most clicks.
- Segment by Channel and Audience: Analyze CTR across different traffic sources like organic search, email, and social media. A headline that works wonders on LinkedIn may fall flat in an email newsletter. Tailor your content's presentation to the specific context and expectations of each platform.
5. Conversion Rate
Conversion rate is the metric that connects content directly to your business goals. It measures the percentage of users who complete a desired action after interacting with your content, such as making a purchase, signing up for a newsletter, or downloading a resource. Calculated by dividing total conversions by total visitors, this is one of the most critical content performance metrics because it provides a clear, quantifiable measure of your content's effectiveness and its direct contribution to your bottom line.

While traffic and engagement are important, a high conversion rate proves your content is not just being seen, but is actively persuading your audience to act. For instance, Amazon meticulously optimizes every element on its product pages, from descriptions to user reviews, to achieve conversion rates often exceeding 10%, far above the e-commerce average. Similarly, HubSpot leverages its vast library of educational content to generate hundreds of thousands of leads, with its targeted landing pages frequently achieving conversion rates of 10-20% by offering high-value resources in exchange for user information.
How to Leverage Conversion Rate Data
To improve this crucial metric, focus on aligning content with user intent and removing any barriers to action. A strategic approach can turn passive readers into active customers.
- Align Content with the Buyer's Journey: Create content that specifically addresses the needs and questions of users at each stage of the funnel. An informational blog post should lead to a downloadable guide, which in turn leads to a product demo signup.
- Build Trust with Social Proof: Integrate customer testimonials, case studies, user reviews, and trust badges prominently within your content and on your landing pages. This reassures potential customers and validates their decision to convert.
- Minimize Friction: Simplify your forms, clarify your call-to-action (CTA), and ensure the conversion process is seamless, especially on mobile devices. Every unnecessary field or confusing step is a potential point of abandonment. For additional strategies, you can learn more about proven e-commerce conversion rate optimization tactics to enhance your results.
- Test and Refine Your CTAs: Continuously A/B test different elements like your offer, CTA button copy and color, and form length to identify what drives the highest performance. To apply conversion metrics in specific marketing contexts, delve deeper into how effective affiliate conversion tracking can boost ROI and campaign performance.
6. Bounce Rate
Bounce rate measures the percentage of visitors who navigate away from your site after viewing only one page. Essentially, a "bounce" happens when a user lands on a page and leaves without clicking any links, filling out a form, or interacting further. Popularized by Google Analytics, this metric is one of the most debated yet crucial content performance metrics, offering a stark evaluation of whether your content meets visitor expectations upon arrival.
A high bounce rate can indicate a disconnect between what users expected and what they found. For example, recipe blogs like Pinch of Yum combat high bounce rates by surrounding their core recipe with engaging elements like step-by-step photos, video tutorials, and links to related dishes, encouraging users to explore. Similarly, SaaS companies like Slack significantly reduced bounce rates by refining their landing page copy to present a crystal-clear value proposition, ensuring visitors immediately understood the product's benefits and were compelled to learn more. A low bounce rate suggests your content is relevant, engaging, and successfully guiding users deeper into your site.
How to Leverage Bounce Rate Data
Analyzing bounce rate in context is key to turning this metric into an actionable tool for improving user experience and content strategy. A high bounce rate isn't always negative; for instance, a user finding a phone number on a contact page and leaving is a successful visit.
- Segment by Traffic Source: Compare bounce rates across channels like organic search, paid ads, and social media. A high bounce rate from a specific ad campaign may mean your ad copy is misaligned with the landing page content.
- Analyze by Content Type: Examine bounce rates for different pages. A blog post might have a higher bounce rate than a product page, which is normal. However, unusually high rates on key conversion pages signal urgent problems with design, copy, or user flow.
- Improve Page Load Speed: Slow-loading pages are a primary cause of bounces. Ensure your pages load in under three seconds to keep impatient visitors from leaving before your content even appears.
- Enhance Content and Engagement: Make your content scannable with clear headings, short paragraphs, and bullet points. Embed engaging visuals, videos, and clear calls-to-action (CTAs) that encourage users to take the next step.
- Strengthen Internal Linking: Strategically place internal links to related articles, products, or resources throughout your content. This provides a clear path for engaged readers to continue their journey on your site, directly lowering your bounce rate.
7. Content Shares and Viral Coefficient
Content shares measure how often users distribute your content across social media, email, or other channels. This metric, combined with its advanced counterpart, the viral coefficient, offers a powerful gauge of your content's resonance and organic growth potential. While shares are a direct indicator of quality and audience approval, the viral coefficient quantifies this spread by calculating how many new users each existing user brings through sharing. It’s one of the most critical content performance metrics for understanding exponential growth.
The viral coefficient is calculated as the number of invites sent per user multiplied by the conversion rate of those invites. For example, the ALS Ice Bucket Challenge achieved a massive viral spread because participants nominated multiple friends, creating an exponential loop. Similarly, Dollar Shave Club's launch video went viral not just from passive views, but because its humor was so shareable it created brand advocates overnight, generating millions of views and subscribers. This demonstrates how shareability can be engineered to drive tangible business results.
How to Leverage Shares and Viral Coefficient
Boosting shares and achieving virality requires a strategic approach that blends emotional appeal with frictionless execution. Focus on creating content that people feel compelled to pass along.
- Create Emotionally Resonant Content: Tap into universal emotions like humor, inspiration, awe, or even controversy. Content that makes people feel something is content they want to share with their network to evoke the same feeling in others.
- Make Sharing Effortless: Place prominent, easily recognizable social sharing buttons on all your content. Pre-populate share messages with compelling text and relevant hashtags to remove any friction from the process.
- Design for Shareability: Break down your content into shareable "nuggets." Include powerful quotes, surprising statistics, or striking visual elements like infographics that are easy to screenshot and post.
- Amplify Early Momentum: Actively engage with the first people who share your content. Thanking them or re-sharing their posts can encourage a second wave of distribution and signal to social algorithms that your content is gaining traction.
To better understand how these components interact, the data chart below visualizes the core elements that determine your content's viral coefficient.
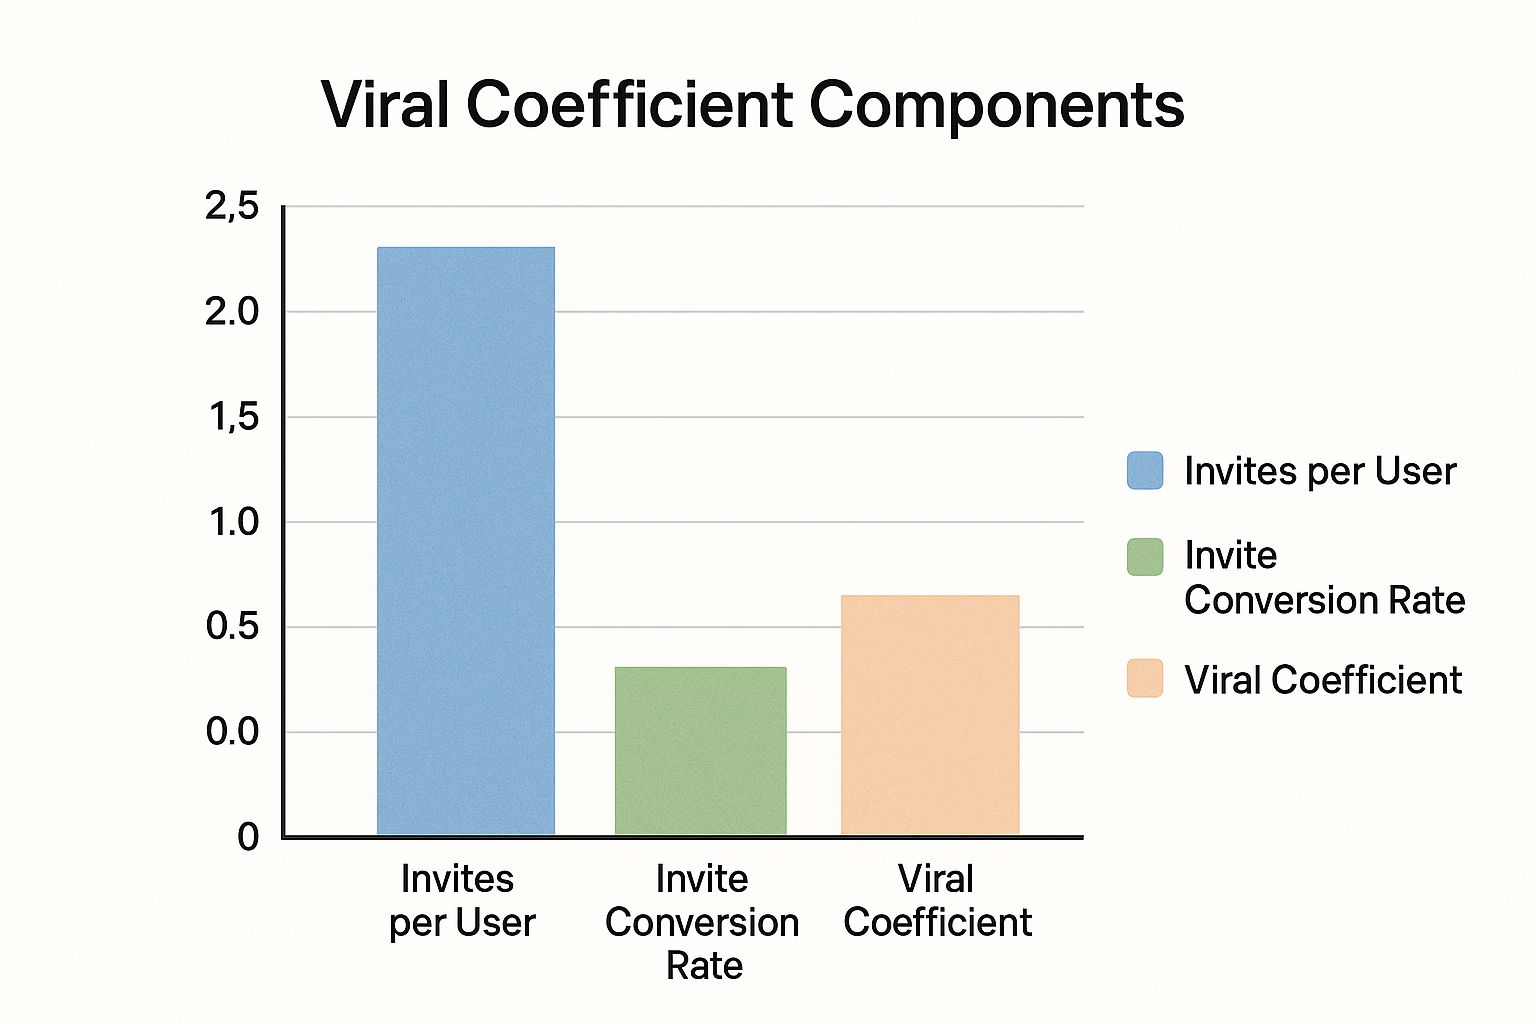
The bar chart highlights that both a high number of invites per user and a strong invite conversion rate are necessary to achieve a meaningful viral coefficient.
8. Return on Investment (ROI) and Revenue Attribution
Return on Investment (ROI) is the ultimate bottom-line metric, measuring the total profit generated from your content marketing efforts relative to their cost. It answers the most critical question for any business: is our content actually making money? Paired with revenue attribution, which connects specific sales to individual content pieces, ROI moves beyond engagement and traffic to evaluate content as a true business asset. These are arguably the most important content performance metrics for justifying budgets and proving value to stakeholders.
Calculating ROI ([(Revenue - Investment) / Investment] x 100) transforms content from a creative expense into a measurable growth engine. While many metrics track user behavior, ROI and attribution tie that behavior directly to financial outcomes. For example, HubSpot famously demonstrated that its content marketing generates three times more leads than traditional methods at a 62% lower cost, a clear ROI-driven proof point. Similarly, American Express's OPEN Forum reportedly generated over $10 million in revenue by attributing sales back to its small business content, showcasing the direct link between high-value content and profitability.
How to Leverage ROI and Revenue Attribution Data
Connecting content to revenue requires a systematic approach to tracking and analysis. You must look beyond last-click attribution to understand content's full impact across the customer journey.
- Implement Robust Tracking: Use a combination of UTM parameters, marketing automation software (like HubSpot or Marketo), and CRM data to track users from their first content interaction to their final purchase. This creates a complete view of the customer journey.
- Calculate All Costs: To get an accurate ROI, you must include all associated expenses. This includes content creation fees (writers, designers), promotional spending (ads, social media boosts), technology and tool subscriptions, and the prorated salaries of your content team.
- Analyze Direct and Assisted Conversions: Attribute revenue not just to the content that drove the final click but also to the pieces that influenced the user earlier in their journey. A blog post might not close a deal directly, but it may be a crucial first touchpoint that qualifies as an assisted conversion, demonstrating its long-term value.
- Use Cohort Analysis: Group users who engaged with your content in a specific period (e.g., Q1) and track their purchase behavior over the long term. This helps reveal the delayed financial impact of your content, which is often missed in short-term reporting.
Content Performance Metrics Comparison
From Metrics to Mastery: Unlocking Growth with Aeon
Navigating the complex landscape of digital publishing requires more than just creating great content; it demands a deep, analytical understanding of its performance. Throughout this guide, we've explored the essential content performance metrics that form the bedrock of a successful strategy. From foundational traffic indicators like Page Views to sophisticated business-oriented measures such as ROI and Revenue Attribution, each metric tells a crucial part of your content's story.
We've moved beyond surface-level definitions to uncover actionable insights. You now know that a high Time on Page isn't just a vanity metric; it's a direct signal of audience captivation and a leading indicator of conversion potential. Similarly, a strong Social Media Engagement Rate and a high Viral Coefficient are not just about popularity; they represent your content's ability to build a community and create an organic marketing engine that expands your reach exponentially. The goal is to see these numbers not as isolated data points on a dashboard, but as interconnected clues that reveal what truly resonates with your audience.
Turning Data into Actionable Strategy
The true power of content performance metrics is unlocked when you use them to make informed, strategic decisions. A low Click-Through Rate (CTR) prompts a re-evaluation of your headlines and thumbnails, while a high Bounce Rate might signal a mismatch between your content's promise and its delivery. These metrics are your guideposts, pointing you toward necessary optimizations and new opportunities for growth.
The overarching lesson is clear: data must fuel action. By consistently analyzing these key performance indicators, you can build a powerful feedback loop. This iterative process of measuring, analyzing, and refining is what separates stagnant content libraries from dynamic, high-performing publishing powerhouses. It allows you to systematically improve your content, strengthen audience relationships, and ultimately, drive meaningful business results.
The Next Frontier: Scaling Success with Video
As you analyze your data, a consistent theme will likely emerge: the formats that command the most attention, engagement, and retention often involve rich media. Video, in particular, excels at capturing and holding audience interest, directly boosting metrics like Time on Page and social shares. The challenge, however, has always been the resource-intensive nature of video production. How can you scale video output to capitalize on every high-performing piece of content without draining your budget and team?
This is precisely where Aeon transforms your capabilities. Instead of just identifying your top-performing articles, you can now instantly act on that insight. Aeon empowers your team to convert those proven, high-engagement blog posts, reports, or even audio clips into dynamic, professionally branded videos in minutes. By automating the creation process based on the data you're already tracking, Aeon bridges the gap between insight and execution, allowing you to replicate and scale your biggest content wins effortlessly.
Stop letting your best-performing content exist in a single format. Discover how Aeon can help you multiply the impact of your most successful work by transforming it into engaging video content. Explore Aeon today and start turning your content performance metrics into a scalable engine for growth.