How to Measure Content Performance and Prove Its Value
Learn how to measure content performance with our expert guide. Discover the right metrics, tools, and strategies to prove your content's ROI and impact.
Dan Benyamin
Aug 28, 2025
In This Article
Subscribe to our newsletter
To really know if your content is working, you have to tie it back to what the business actually cares about. This is about moving past vanity metrics like page views and digging into the Key Performance Indicators (KPIs) that show your content is doing its job—whether that's bringing in leads, closing sales, or making your brand the go-to name in your industry.
Building Your Content Measurement Foundation
Before you get lost in analytics dashboards and spreadsheets, you need a plan. Without one, you’re just collecting numbers that don't tell a story. The secret to great content measurement isn't tracking every single click and view; it's about tracking the right things.
It all starts with going back to the "why." Why did you create this content strategy in the first place? The answer to that question is the key to your entire measurement approach.
Aligning Goals with Measurable KPIs
Every blog post, video, or case study needs a job to do. Your first task is to define that job clearly and then pick the metrics that show how well it's performing. Fuzzy goals like "increase engagement" just won't cut it. You need to get specific.
Let's say your company just launched a new software feature.
Business Goal: Increase qualified leads for the new feature.
Content Goal: Get targeted traffic to the feature's landing page and get people to sign up for a demo.
Relevant KPIs: The conversion rate on your landing page form, how much organic search traffic is hitting that page, and the number of marketing-qualified leads (MQLs) you generate.
Or maybe the goal is less about direct sales and more about building your brand's reputation.
Business Goal: Position the company as a thought leader in your niche.
Content Goal: Publish authoritative articles that get shared and linked to by others in the industry.
Relevant KPIs: The number of social shares, backlinks from reputable sites, and an increase in people searching for your brand name.
Here’s the bottom line: If a metric doesn't help you make a smarter decision or show you're getting closer to a business goal, it's probably just a vanity metric. Focus your energy on data that truly matters.
Establishing a Performance Baseline
Once you know what you’re measuring, you need a starting point. This baseline is your "before" picture, letting you see growth and understand the real impact of your work over time. Take a snapshot of your chosen KPIs for a set period—like the month before you launch a big content campaign—to lock in your current performance.
Having that initial benchmark means you can answer crucial questions later, like, "Did our new blog series actually drive more newsletter sign-ups than we got last quarter?"
To really build a strong foundation, check out this ultimate guide to content marketing analytics. It helps put your data into context, turning those raw numbers into a clear story of what's working and what needs to change. Without a baseline, you're just flying blind.
Matching Metrics to Your Customer Journey
Measuring content performance isn’t about chasing every vanity metric under the sun. It’s about picking the right ones that tell you if your content is actually doing its job at each stage of the customer journey. You wouldn't judge a top-of-funnel blog post by sales numbers, just like you wouldn't judge a case study by social shares.
This is where the classic marketing funnel—Awareness, Consideration, and Decision—comes in handy. It gives you a clear framework. By mapping your KPIs to each stage, you can finally stop asking, "Is this content any good?" and start asking, "Is this content achieving its specific goal?"
Metrics for the Awareness Stage
At the top of the funnel, it's all about getting noticed. Your goal is to attract new eyeballs and introduce them to your brand for the first time. Think blog posts, infographics, and social media content—pieces designed for discovery. You’re not going for the hard sell; you’re just trying to make a great first impression.
The metrics that matter here are all about reach and visibility.
Organic Traffic: Are people finding you through search engines? This is your bread and butter.
Impressions: How many times did your content appear in front of someone, whether on Google or their social feed?
Social Shares: Is your content valuable enough that people are willing to stake their own reputation on it by sharing it?
Backlinks: Are other websites treating your content as a go-to resource? This is a huge signal of authority.
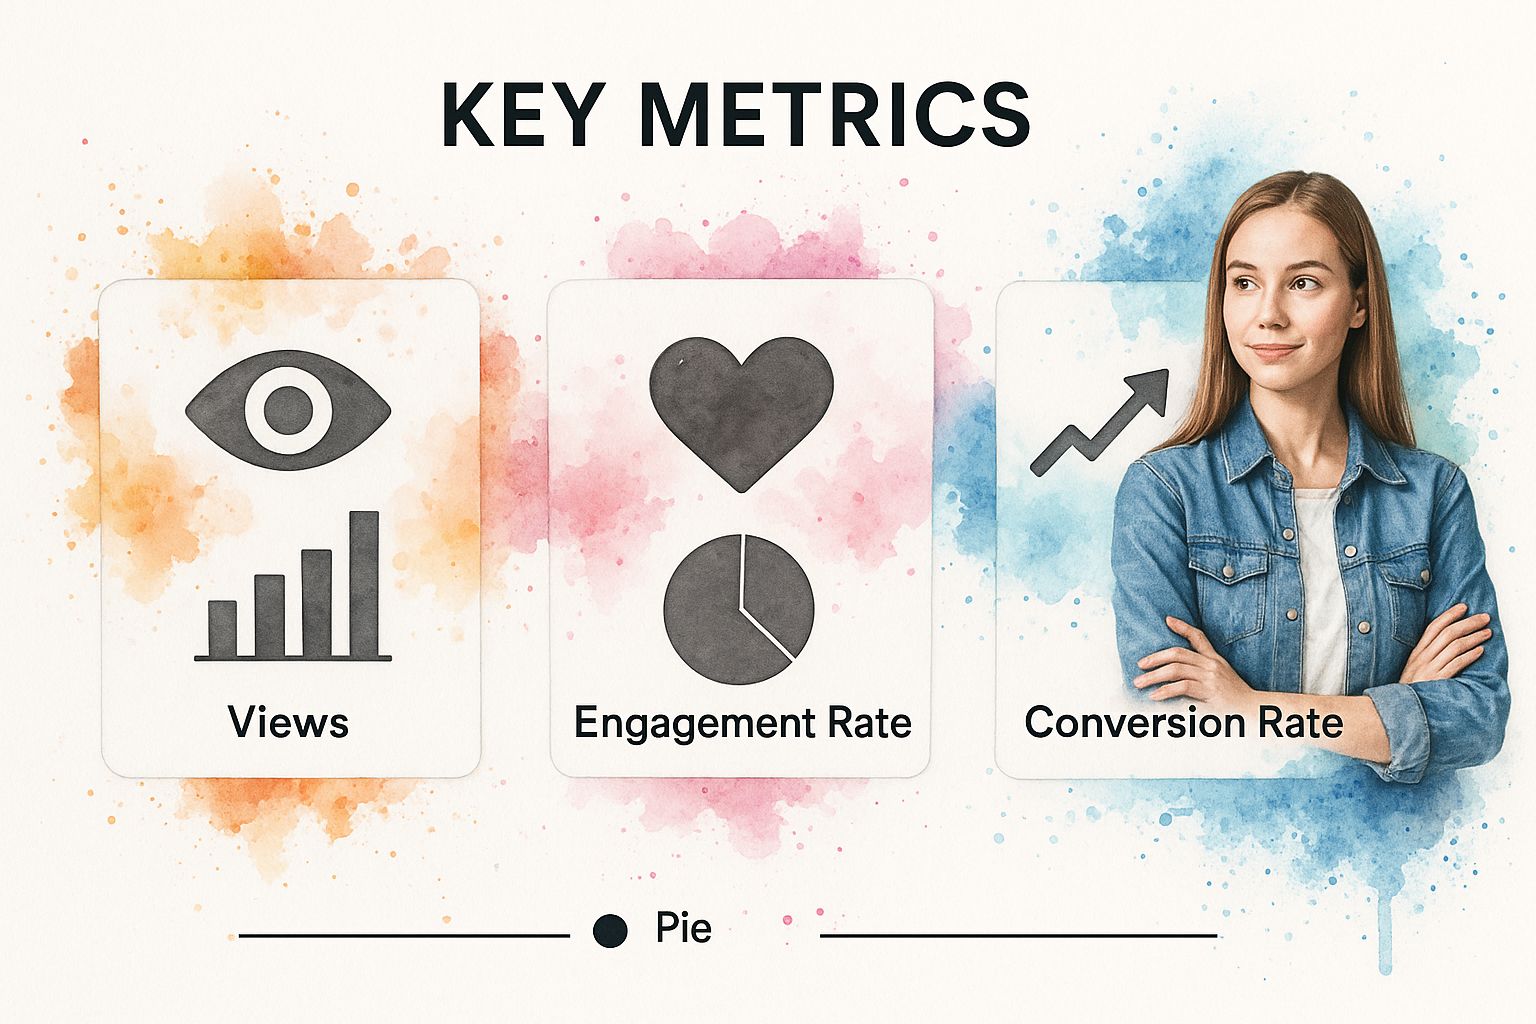
This infographic lays out how to think about measuring performance across the entire journey.
It shows the evolution from simple views to genuine engagement and, ultimately, to the conversions that actually grow your business.
Metrics for the Consideration Stage
Okay, you’ve got their attention. Now what? The middle of the funnel is where you build trust and show off your expertise. Your audience is actively looking for solutions, so content like in-depth guides, webinars, and ebooks is king here.
The focus shifts from pure reach to deep engagement. You need to know if people see you as a credible authority worth listening to.
Key metrics to watch:
Time on Page / Scroll Depth: Are people actually reading what you wrote, or are they hitting the back button in five seconds?
Newsletter Sign-ups: Is your content so good they’re willing to give you their email to get more?
Asset Downloads: How many people are taking the next step by downloading your whitepapers or ebooks?
Returning Visitors: Are you building a community of people who keep coming back for more?
A high download rate on an ebook is a far stronger buying signal than thousands of fleeting page views on a blog post. Engagement metrics separate the curious from the committed.
Metrics for the Decision Stage
This is the moment of truth. At the bottom of the funnel, your audience is ready to pull the trigger. They're comparing you against competitors and need that final piece of proof. This is where your case studies, product demos, and comparison pages do the heavy lifting.
At this stage, performance is all about one thing: conversion.
Conversion Rate: What percentage of people are taking that final action, like booking a demo or starting a free trial?
Content-Assisted Conversions: Which articles or guides did someone read before they converted? This helps you see the hidden value of your entire content ecosystem.
Leads Generated: How many sales-qualified leads can you directly attribute to a specific piece of content?
This detailed approach is quickly becoming the new standard. By 2025, the most successful marketers will have moved far beyond surface-level stats, focusing instead on a mix of metrics like Time on Page, Conversion Rate, and ROI to prove their impact. To get a jump on this, check out these 8 essential content performance metrics.
To pull this all together, here’s a simple table mapping key metrics to each stage of the marketing funnel. This is a great starting point for building your own measurement framework.
Content Metrics Mapped to the Marketing Funnel
Funnel Stage
Primary Goal
Key Metrics to Track
Example Content
Awareness
Attract a new audience & build brand recognition
Organic Traffic, Social Shares, Impressions, Backlinks
Blog Posts, Infographics, Social Media Updates
Consideration
Nurture interest & demonstrate expertise
Time on Page, Newsletter Sign-ups, Asset Downloads, Returning Visitors
Using a funnel-based approach ensures you’re not just creating content, but creating content that guides potential customers from discovery all the way to a final decision. It’s about being strategic, not just busy.
Setting Up Your Content Analytics Toolkit
A brilliant content strategy is useless if you can't measure it. Without the right analytics setup, you're basically just guessing what works and what doesn't. Getting your systems configured correctly from the start is the difference between drowning in confusing data and uncovering real insights that push your strategy forward.
Today, the foundation of any serious analytics stack has to be Google Analytics 4 (GA4). The days of just tracking pageviews are long gone. GA4 uses an event-based model, which is a much better way to understand how people actually interact with your content. You can track meaningful actions like video plays, file downloads, or how far someone scrolls down a page, often right out of the box.
This new model lets you answer much more interesting questions. Instead of just knowing how many people landed on a page, you can see how many of them scrolled 90% of the way through your long-form guide. Or how many clicked to download that case study you spent weeks on. These are the engagement signals that tell the true story of your content's quality.
Creating a Unified Data Ecosystem
To get the full picture, you have to connect your data sources. When your data is stuck in different silos, you miss connections and can't see the whole story. The goal is to build an ecosystem where information flows between your most important platforms.
At a minimum, you need to integrate these tools:
Google Analytics 4 and Google Search Console: This one is non-negotiable. Connecting them pulls vital organic search data right into your GA4 reports. You can see which search queries are bringing people to specific articles, along with impressions, clicks, and your average rank for each piece of content.
Analytics and Your CRM: This is where you connect your content to actual revenue. Linking GA4 with your CRM (like HubSpot or Salesforce) lets you see which blog posts a person read before they became a lead or, even better, a customer. It’s how you finally bridge the gap between someone reading an article and your company making money.
This kind of integration is what allows you to move past vanity metrics and start proving the real business value of your work.
Visualizing Your Most Important Metrics
Let's be honest, raw data is a nightmare to look at. The final piece of your toolkit is a way to visualize the metrics that actually matter so you can understand them at a glance. This is where custom dashboards come in. A good dashboard pulls your most important KPIs into one place, saving you from digging through a dozen different reports.
The most effective content measurement isn’t about having more data; it’s about having more clarity. A dashboard transforms complex numbers into a clear, understandable narrative about what’s working and what isn’t.
If you want to get serious about monitoring your content's performance, learning how to build a powerful marketing analytics dashboard is a must. By getting these tools and integrations set up properly, you create a powerful system that gives you a complete view of the user journey—from the first click all the way to the final sale.
How to Analyze and Interpret Your Content Data
Collecting data is one thing; finding the story hidden inside the numbers is where the magic really happens.
The big shift comes when you stop asking "what happened?" and start asking "why did it happen?" This is the difference between simply reporting on metrics and actually analyzing them to build a smarter content strategy.
For example, a high bounce rate on a blog post looks bad on the surface. But context is everything. If that post was designed to answer one specific question quickly, then a high bounce rate might actually be a win—the user got their answer and left happy. On the other hand, if you're seeing that same high bounce rate on a pillar page meant to draw readers in, you’ve got a problem.
This kind of nuanced understanding is the heart of real content performance analysis. You have to look beyond a single data point and start connecting the dots to see the bigger picture.
Moving from Data to Insights
True analysis is about tying different metrics together. A big spike in traffic is great, but did it lead to more email sign-ups? Did that flurry of social shares bring in any new backlinks? These are the questions that lead to real, actionable insights.
A 2025 survey shows how other marketers are thinking about this. While 55% prioritize traffic as their main metric, 50% are also tracking social media engagement, and 42% see conversions as critical. It's a balanced approach. To connect these dots, most are using tools like Google Analytics (with 64% adoption). You can dig into more of these numbers in the full content marketing statistics report.
To make this practical, start by bucketing your content:
Top Performers: These are your all-stars. Figure out what makes them tick. Is it the topic? The format? The promotion channel? Your job is to find the secret sauce and use it again.
Underperformers: These are the pieces that are falling flat. They might just need a content refresh, a catchier headline, or some better internal links to give them a boost.
Content Gaps: What is your audience searching for that you haven't covered? Dive into Google Search Console and look at the search queries. That’s a goldmine for new ideas.
The point of data analysis isn't to build perfect dashboards. It's to find one or two key insights that will make your next piece of content—or your whole strategy—that much better.
Conducting a Performance-Based Content Audit
A content audit is how you turn these insights into action. It's a systematic review of all your content, stacking each piece up against your KPIs.
This process gives you a clear, data-backed path for deciding what to keep, what to improve, and what to get rid of completely.
For a more detailed breakdown, our guide on how to analyze marketing data walks you through it step-by-step. By making audits a regular habit, you ensure every piece of content is actively working toward your goals, not just collecting dust.
Translating Insights into Action and Proving ROI
Let's be honest: the point of measuring content performance isn't to create beautiful reports. It's about making smarter decisions that actually grow the business. Once you've dug through the data, the real work begins. You have to close the loop, turning those numbers into tangible actions and proving the financial value of it all.
This is where you build a feedback system where your analytics directly fuel your content strategy. The numbers should tell you exactly what to do next.
Creating a Data-Informed Editorial Calendar
Think of your performance data as a roadmap for your future content. It’s your best tool for building a powerful feedback loop that consistently sharpens your results.
Double Down on Winners: Find your top-performing articles, videos, and guides. What was it about them? Was it the topic, the format, the headline? Pinpoint those winning elements and build more content around them.
Refresh Underperformers: We all have content with high potential but low performance—maybe a great post that’s stuck on page two of Google. A quick content refresh with updated stats, better visuals, or a few strong internal links can be all it takes to push it to page one.
Experiment with Formats: Does your data show sky-high engagement on a specific content type? It’s time to expand. A blog post that everyone loved can be repurposed into an engaging video or a bite-sized social media carousel. Our guide on video content marketing strategies that convert has some great ideas for this.
This data-driven approach takes the guesswork out of your editorial planning. Every piece you create will have a clear, evidence-backed purpose.
It also helps you get beyond chasing raw page views. A much better signal of audience interest, for example, is tracking "Engaged Sessions"—visits that last over 10 seconds and involve some kind of interaction. Smart marketers are now prioritizing these kinds of metrics and tracking content-assisted conversions to see the full buyer's journey.
Calculating and Communicating Content ROI
Proving Return on Investment (ROI) is how you secure your budget and get a real seat at the strategy table. The fundamental formula is simple: (Revenue from Content - Cost of Content) / Cost of Content. The real challenge is attributing that revenue accurately.
Let’s face it, attributing a sale to a single blog post is often impossible. A better approach is to show how content influences revenue at every single stage of the funnel, from the very first touchpoint to the final click.
To pull this off, you need an attribution model that makes sense for your business. A first-touch attribution model gives all the credit to the first piece of content a customer ever saw. On the other hand, a multi-touch model spreads the credit across all the touchpoints in their journey. The second option almost always gives you a more realistic view of how your entire content ecosystem works together to nurture leads.
When it's time to present to stakeholders, keep it simple. Build clean reports that tie your KPIs directly to the company's business objectives. Your job is to tell a clear, compelling story about how your content is making a direct impact on the bottom line. To really dig into the financial impact, you’ll want to master content marketing attribution for better ROI.
Common Questions About Content Performance
Even with a solid framework, measuring content performance can feel a bit like reading tea leaves. It’s tricky stuff, and you’re not alone if you find yourself wrestling with the data.
Let's clear up some of the most common questions marketers have. Think of this as your quick-reference guide for getting unstuck and moving forward with confidence.
What Are the Most Important Metrics for a Beginner?
If you're just dipping your toes into analytics, the sheer volume of data can be overwhelming. My advice? Don't even try to track everything. You'll just end up with a spreadsheet full of numbers and no real story.
Instead, focus on a handful of core metrics that give you a balanced picture of what's happening. Start with these four:
Organic Traffic: How many people are finding your content through a search engine? This is a fundamental indicator of your content's visibility and SEO health.
Average Time on Page: This tells you if people are actually reading what you wrote. A high time on page means you've hooked them; a low one means they clicked and bounced.
Conversion Rate: Are people taking the action you want them to? Start with something simple, like a newsletter signup, to see if your content is persuasive enough to inspire action.
Social Shares: Is your content valuable enough that people are willing to share it with their own networks? This is a great gauge of audience resonance.
Focusing on just these metrics gives you a solid baseline for understanding performance without getting lost in the noise. It’s all about clarity over complexity.
How Often Should I Review My Content Performance?
This is a classic question, and the answer is: it depends entirely on your goals. There's no one-size-fits-all schedule.
For big-picture strategic planning and spotting long-term trends, a monthly review is perfect. It gives your data enough time to accumulate so you can see meaningful patterns instead of reacting to tiny, daily blips.
But if you've just launched a new campaign or published a cornerstone article, you'll want to be more nimble. A weekly check-in is much better in this case. It lets you make timely tweaks and optimizations before it's too late.
Whatever you do, resist the urge to check your data daily. It’s a fast track to "analysis paralysis" where you second-guess every minor shift. Setting up automated reports is a great way to stay consistent without getting obsessive.
How Do I Measure Content That Does Not Directly Convert?
Not every piece of content is meant to drive a sale right then and there. A lot of top-of-funnel content, like blog posts or guides, is designed to build authority, earn trust, and nurture an audience over time.
So, how do you measure the success of something that doesn't have a "Buy Now" button? You have to look at different signals of value.
Instead of direct conversions, track these kinds of metrics:
New vs. Returning Users: Is your content building a loyal audience that keeps coming back for more? That's a huge win.
Backlinks Acquired: Use an SEO tool to see how many other websites are linking to your content. A backlink is a powerful vote of confidence in your content's authority.
Scroll Depth: How far down the page are people actually reading? This tells you if your content is truly engaging them from start to finish.
Content-Assisted Conversions: Dig into Google Analytics to see if a post was part of a user's journey toward an eventual conversion. It might not have been the last click, but it played a crucial role.
At Aeon, we're obsessed with the power of data-driven content. Our platform not only helps you create incredible videos at scale but also gives you the insights needed to measure their true impact. Ready to see what that looks like? Explore the future of video creation at https://www.project-aeon.com.
Share the article
Contributor
Dan Benyamin
Dan served as VP of Data Products at Condé Nast, following their acquisition of CitizenNet, a social media marketing platform he founded.
Learn how to transform your slides by turning PowerPoint into a video. Our guide covers everything from slide prep to professional audio for maximum...


.jpg)