
How do you stack up against your competitors?
We built a report that tells you how much your competitor is making with video on their website and what you can do about it. Want the report? To join the waitlist, e-mail me with the subject line "Adam, I want my revenue report!"
* 100k monthly PVs at minimum for a decent report
** Data is not verified, the report is subject to change, and should only be used for directional purposes.
Wired.com and TheVerge.com Analysis
A twelve-month analysis from data comparing wired.com and theverge.com reveals compelling evidence for strategic investment in video content. This study examines the measurable impact of video strategy on revenue generation, market position, and advertiser relationships in digital publishing.
Market Performance Analysis
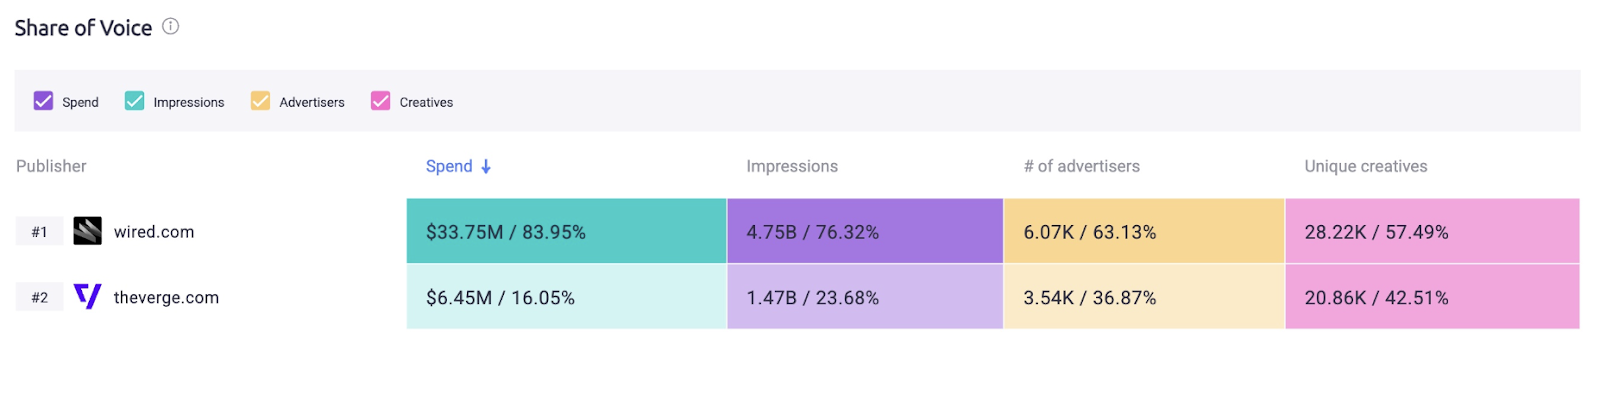
The data presents a clear picture of market dominance through video investment. Wired.com's commitment to video content resulted in commanding 78.55% of total market impressions, while theverge.com captured 29.48%. This dramatic difference extends to advertising reach, where Wired secured 63.15% compared to Theverge's 26.87%. The overall share of voice metrics reinforce this gap, with Wired maintaining 57.49% against Theverge's 42.51%.
These metrics demonstrate how video investment creates a multiplier effect across key performance indicators. Publishers who commit to video content don't just see improvements in one area – they experience growth across their entire market position.
Revenue Generation
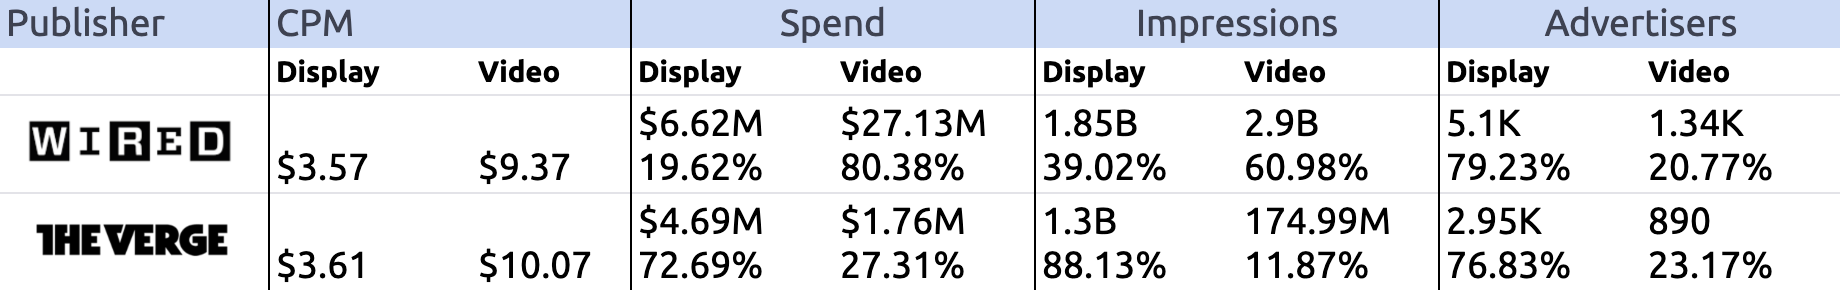
The revenue impact of video investment manifests through multiple channels. Video inventory consistently commands premium CPM rates, often achieving more than double the rates of traditional display advertising. This pricing power has remained stable even during market fluctuations, suggesting that video's value proposition to advertisers remains strong regardless of market conditions.
Expenditure trends over the twelve-month period tell an important story about the shifting media landscape. Video spend increased by 23.61% year-over-year, while traditional display advertising saw a 15.37% decrease. This shift reflects both changing advertiser preferences and the superior performance of video content in engaging audiences.
Implementation Framework
Success in video strategy requires systematic implementation across three key areas: technical infrastructure, production capabilities, and measurement systems. The technical foundation must include robust video hosting, efficient distribution networks, and integrated analytics systems. Publishers cannot succeed with partial implementation – the data shows that comprehensive infrastructure investment precedes significant revenue gains.
Production frameworks represent the second critical component. Publishers must develop in-house capabilities or partner with scalable video solutions like Aeon, for consistent content creation, maintaining quality standards while managing costs. The data suggests that successful publishers implement rigorous asset management systems and distribution workflows to maximize the return on their video investments.
Measurement systems form the third pillar of successful implementation. Publishers who succeed in video maintain sophisticated tracking of costs per asset, revenue by format, and engagement across platforms. This data-driven approach enables continuous optimization and helps justify ongoing investment in video capabilities.
Return on Investment
The financial case for video investment emerges clearly from the data. Publishers who properly implement video strategies see 2.3 times higher revenue per impression compared to traditional display advertising. Advertiser retention increases by 1.8 times, and average campaign values rise by 15%. These improvements compound over time as publishers build stronger relationships with advertisers and develop more sophisticated video offerings.
Market position benefits extend beyond direct revenue. Publishers with strong video capabilities achieve 57% greater market share and 63% broader advertiser reach. The 78% higher impression volume suggests that video content also drives increased audience engagement and time spent with content.
Strategic Implementation
Successful video strategy implementation follows a clear sequence. Publishers must first establish their technical infrastructure, including platform selection, analytics implementation, and distribution network development. This foundation enables the development of sophisticated revenue structures, including video-specific pricing strategies and sponsorship packages.
Production systems represent the final implementation phase. Publishers must establish clear standards for content creation, quality control processes, and distribution workflows. These systems ensure consistent content quality while managing production costs.
Conclusion
The data presents an unambiguous case for video investment in digital publishing. Publishers who successfully implement video strategies see improvements across all key metrics: higher revenue per impression, expanded market reach, increased pricing power, and a broader advertiser base. However, success requires systematic implementation and ongoing measurement.
The key learning remains clear: video investment, properly implemented, creates a virtuous cycle of improved performance across all aspects of digital publishing. Publishers must approach this opportunity systematically, understanding that infrastructure development and measurement systems form the foundation for revenue growth.
This case study demonstrates that video investment represents not just an opportunity for revenue growth, but a necessity for maintaining competitive position in digital publishing. The data suggests that publishers who delay video investment risk falling behind in market share, revenue generation, and advertiser relationships.